Noise pollution in metro cities is a growing concern as it is slowly affecting our body and mind.
Loud noises can cause ear discomfort, such as ear ringing, ear pains and hearing loss, etc. Noises above 115db can even lead to deafness.
According to statistics, about 50 percent of those who are exposed to the noise above 80db for a long time lose their hearing.
 Click on Image To Enlarge
Noises can cause decrease work efficiency. Under the circumstance of noises above 85db, one may feel
discomfort and distracted, thus he cannot concentrate on his work or study. Long-term exposure to noises may lead to high blood pressure.
Especially in night, noises cause much higher rate of incidence of cardiac and neuro diseases.
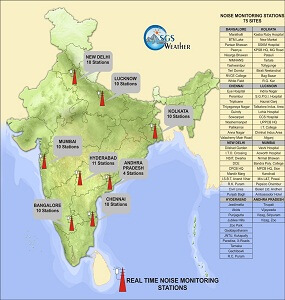
We have installed 75 real time noise pollution monitoring stations in 07 metropolitan cities i.e. Mumbai,
Delhi, Kolkata, Chennai, Bangalore, Lucknow and Hyderabad. These stations are designed to monitor the environmental noise or acoustic contamination
produced by road traffic in cities and roads, airplanes and railway traffic, or noise produced in construction sites.
Our system is an advanced environmental noise monitoring system with real-time data transmission, generating
dynamic noise maps covering areas of interest. The Noise system acquires stores and transmits the noise levels and other meteorological
parameters of each location to a Central Station where the data is received, processed and displayed.
In addition, a website application is made to disseminate the data in real time to the public for their awareness.
The remote stations collect and store the data that then is transmitted via a GPRS communications system to the central database, where they are stored.
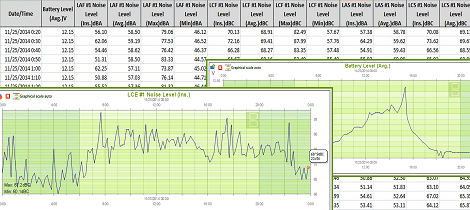
The application accesses this database to display the measured data to the users as numeric data or as time series in graphs. It also allows the data
to be downloaded in several formats (CSV, XML, zip) and display the images captured by the cameras installed on the remote station.
 Beside the real time values the following parameters are derived at the server
Description of parameters
Zone Category: (Silence, Residential, Commercial, Industrial)
LAF/S and LCF/S: (Average and Instantaneous)
Lpeak: Lpeak-day; Lpeak-night;
Leq A Day; Leq A Night;
Leq A Day Min; Leq A Night Min;
Leq A Day Max; Leq A Night Max;
Leq C Day; Leq C Night;
Leq C Day Min; Leq C Night Min;
Leq C Day Max; Leq C Night Max;
L10 & L90
We also provide the consultancy for further analysis to achieve objective like Identification and quantification
of sources of noise pollution in metropolitan cities. Mapping and modeling software is used for visualization of data on impact area, Noise maps
are used for communicating the noise situation to stakeholders, inform areas of planning such as construction, traffic & transport and to build a
common understanding within the community, Software for mapping and prediction to be delivered with proper training to officials for infrastructure
development and Report submission indicating Source identification, quantification and mitigation measures.
 Beside the real time values the following parameters are derived at the server
Description of parameters
Zone Category: (Silence, Residential, Commercial, Industrial)


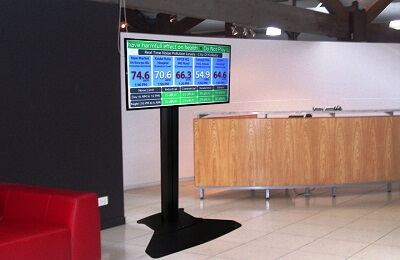
 Some of the major features of our embedded display are:
